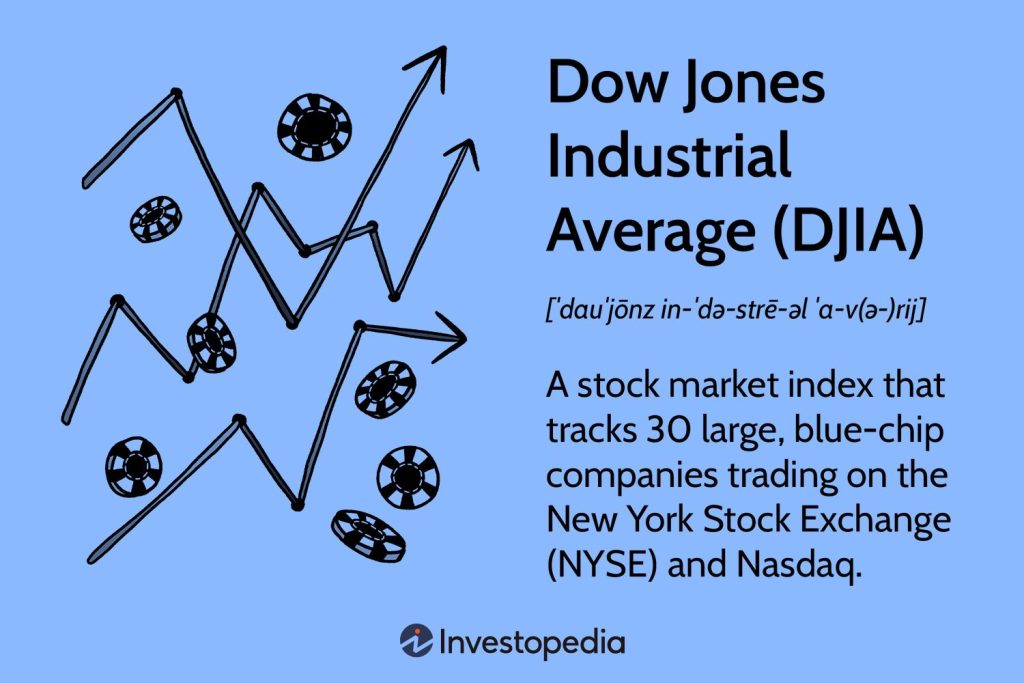
Understanding the dow jones industrial average index: A Comprehensive Guide to Tracking Market Trends and Investing Wisely

Navigating the complexities of the stock market can often feel daunting, especially for those new to investing. At the heart of this intricate world lies the Dow Jones Industrial Average index (DJIA), a key indicator that offers invaluable insights into market trends. This comprehensive guide will demystify the DJIA, breaking down its significance and how it can guide your investment decisions. Understanding this index isn’t just for seasoned investors; even beginners can harness its power to make informed choices.
Whether you’re looking to track the economy’s pulse or refine your investment strategy, grasping the ins and outs of the Dow can be a game changer. Join us as we explore the history, calculation, and implications of the DJIA, equipping you with the knowledge needed to invest wisely and strategically in today’s dynamic marketplace. Get ready to uncover the secrets behind one of the most recognized stock market benchmarks in history.
History and Evolution of the Dow Jones Industrial Average index
The Dow Jones Industrial Average (DJIA) was launched in 1896 by Charles Dow and Edward Jones as a 12-stock index to track America’s industrial economy. Initially dominated by railroads, cotton, and oil companies, it expanded to 30 components in 1928 and shifted focus to reflect evolving industries like technology and healthcare. Key milestones include surpassing 1,000 points in 1972 and 30,000 in 2020, showcasing its resilience through crises like the Great Depression and 2008 financial crash. Today, the DJIA remains a historical anchor, though only General Electric survived from its original roster before being replaced in 2018.
How the Dow Jones Industrial Average is Calculated
The DJIA uses a price-weighted formula, where stock prices—not market caps—determine each company’s influence. To calculate the index:
1. Sum the prices of all 30 stocks.
2. Divide by the Dow Divisor, a number adjusted for stock splits and dividends to maintain continuity.
For example, if Apple’s stock rises $10, it impacts the index more than a lower-priced stock like Coca-Cola. This method, criticized for skewing toward high-priced stocks, differs from the S&P 500’s market-cap weighting.
Importance of the Dow Jones Industrial Average in Financial Markets
The DJIA acts as a barometer for the U.S. economy, influencing investor sentiment and media narratives. While it represents just 30 companies, its components—like Microsoft and Goldman Sachs—span critical sectors, offering insights into industrial, tech, and consumer trends. During the 2020 pandemic, its 37% drop signaled economic turmoil, while its rebound mirrored recovery hopes. However, critics argue its narrow scope and price-weighted design limit its accuracy compared to broader indices.
Key Components of the Dow Jones Industrial Average
The DJIA’s 30 companies are selected for market leadership, liquidity, and sector representation. As of 2024, top constituents include:
Apple (Technology): Drives innovation and consumer trends.
Boeing (Industrials): Reflects manufacturing and defense spending.
JPMorgan Chase (Financials): Tracks banking sector health.
The index’s committee periodically updates components to stay relevant. For instance, Salesforce replaced ExxonMobil in 2020, emphasizing tech’s growing dominance.
Analyzing Dow Jones Trends: What Investors Should Know
DJIA trends often correlate with macroeconomic factors:
Interest Rates: Rising rates in 2022 triggered a 19% drop as tech stocks faltered.
Earnings Reports: Strong results from Nike or Intel can lift the index.
Geopolitical Events: Trade wars or oil price swings impact industrials and energy stocks.
Technical analysts use tools like moving averages and Fibonacci retracements to predict movements, but the DJIA’s price-weighting requires adjusting strategies compared to other indices.
The Dow Jones Industrial Average vs. Other Market Indices
| Index | Coverage | Weighting Method | Key Focus |
|---|---|---|---|
| DJIA | 30 large-cap U.S. | Price-weighted | Industrial/tech giants |
| S&P 500 | 500 companies | Market-cap-weighted | Broad U.S. economy |
| Nasdaq | 3,000+ tech firms | Market-cap-weighted | Growth and innovation |
| The DJIA’s smaller scope makes it more volatile than the S&P 500 but less diversified 9 12 . |
Strategies for Investing Based on Dow Jones Trends
1. Swing Trading: Capitalize on short-term trends using technical indicators like RSI.
2. ETF Exposure: Invest in SPDR Dow Jones ETF (DIA) for low-cost index tracking.
3. Sector Rotation: Shift investments based on DJIA sector performance (e.g., tech vs. healthcare)。
4. Risk Management: Use stop-loss orders and diversify with bonds to offset volatility.
Common Misconceptions about the Dow Jones Industrial Average
1. “It’s the Entire Market”: The DJIA covers only 30 stocks, unlike the S&P 500.
2. “High Price = Better Company”: Price-weighting overemphasizes expensive stocks, distorting economic representation.
3. “It Predicts Recessions”: While it reflects sentiment, it’s not a definitive recession indicator.
Conclusion: Making Informed Investment Decisions with the Dow Jones
The DJIA remains a vital tool for gauging market sentiment and economic shifts, but investors should pair it with broader indices like the S&P 500 for balanced exposure. By understanding its calculation quirks, sector biases, and historical context, traders can leverage its trends while mitigating risks through diversification and disciplined strategies.